Contractor Case Study Framework for Measuring AI Automation ROI
Measure AI tool payoff by tracking signed jobs before and after deployment, not just speed.
AI automation ROI starts with a revenue gap. A contractor case study framework measures that gap before deployment, tracks the same numbers afterward, and compares recovered revenue with the full cost of the intervention. Its purpose is to prove whether AI produces more signed jobs.
Why most contractors cannot tell whether their AI tools are working
A contractor pays for an AI tool, sees that work gets done faster, and still cannot tell whether it brought in more signed jobs. The software is busy. It is unclear how much revenue the tool brought in because nobody set a goal before deployment. Without that starting point, a faster process can look like a better business even when bookings have not improved.
Measurement is inadequate. Features used, tasks automated, and hours saved describe activity, but they do not establish how much revenue a tool recovered. A before-and-after comparison connects that activity to a specific pipeline outcome. Without it, a contractor cannot distinguish a productive investment from another subscription fee.
Where contractor revenue actually leaks: the pipeline stages that AI targets
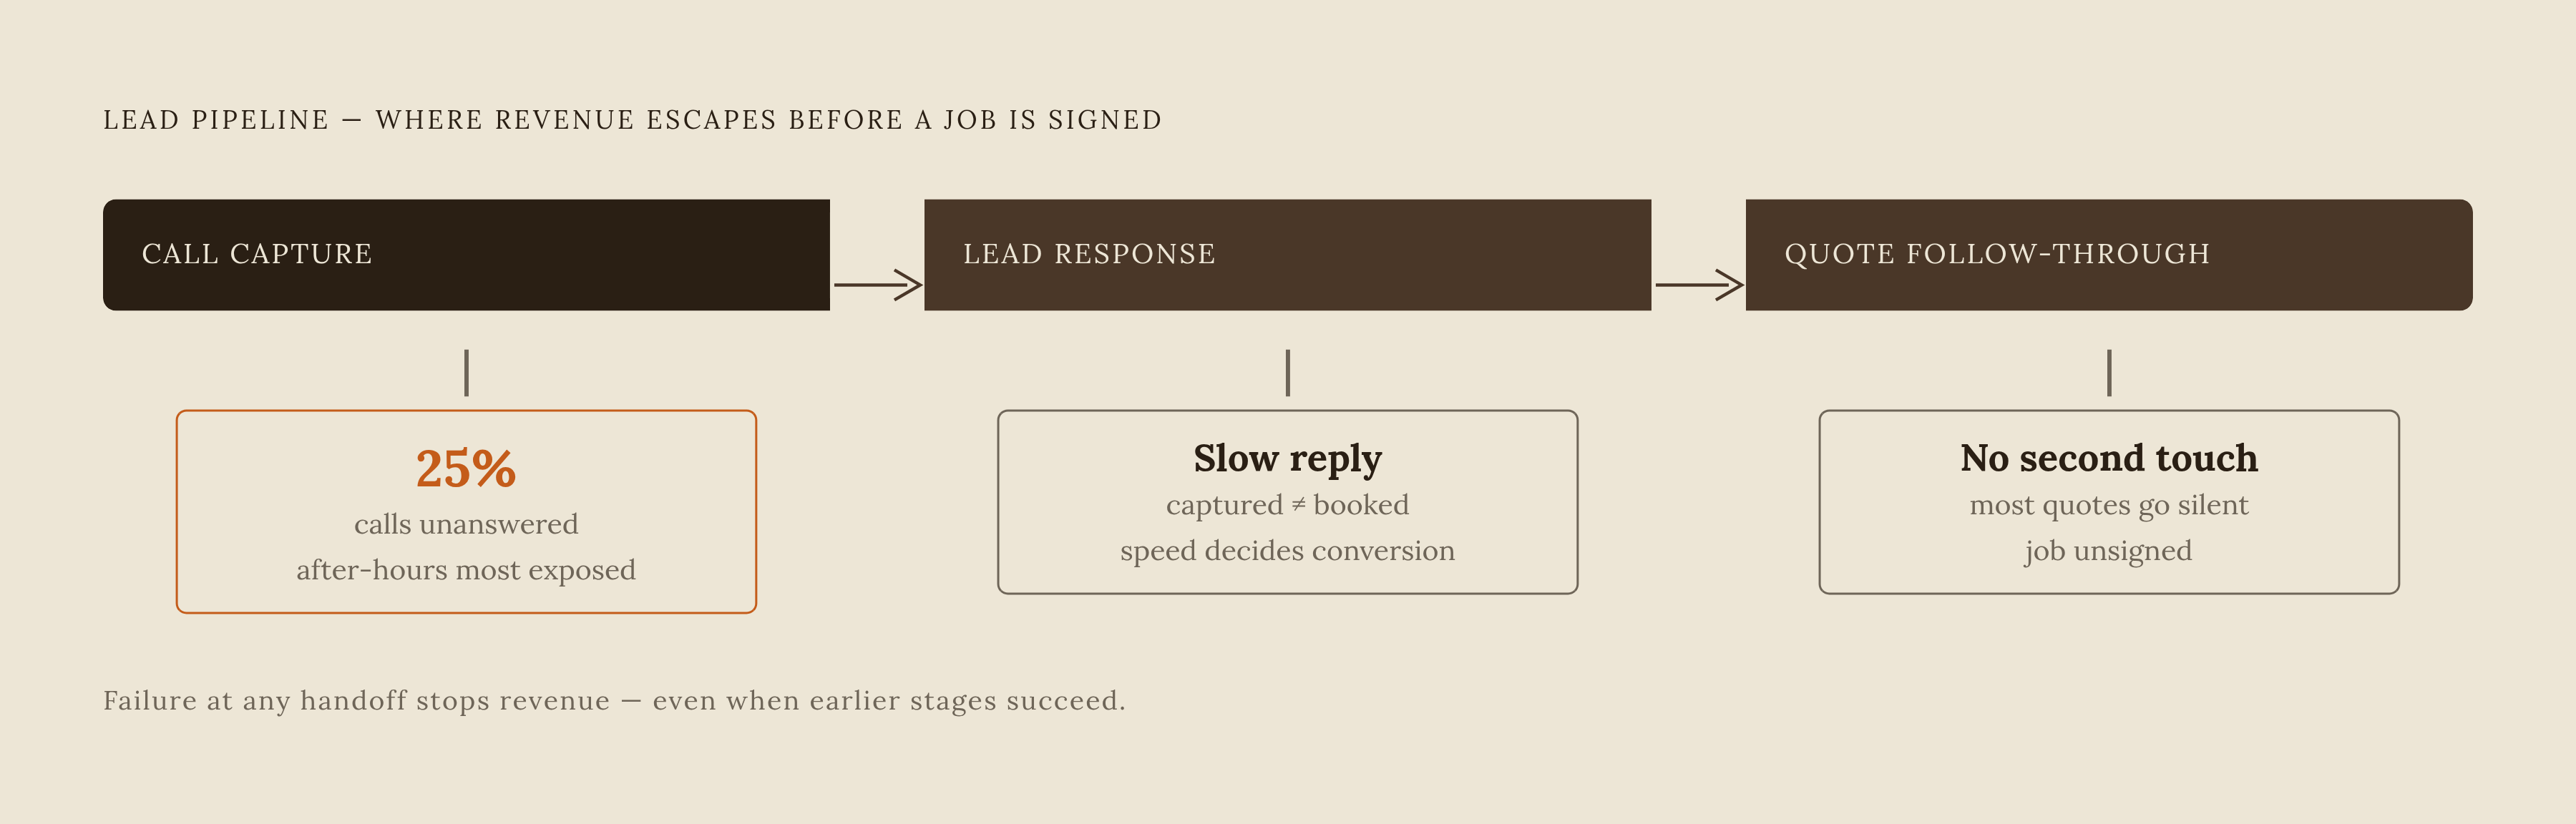
Revenue loss concentrates at three handoffs in the lead-to-signed-job pipeline, namely call capture, lead response speed, and quote follow-through. Home services offices are typically one or two people deep while technicians work in the field. Missed calls account for roughly a quarter of inbound contact in the industry data described in the brief. After-hours calls are especially exposed. When the AC dies on Sunday or a pipe leaks at 10 PM, a customer who reaches voicemail can simply dial the next result.
That is a conversion gap. The customer has already called, and the contractor has already paid to attract that demand. Lead response speed is the next handoff, measured from an inbound call or form fill to the first response. Capturing an inquiry and responding to it are separate events, so a strong call answer rate does not establish that leads receive prompt attention.
Quotes create the third measurable gap in the pipeline. Most quotes that home service contractors send never get a second touch, so jobs that could be won get no follow-through. These jobs are lost when no one follows up, even without a clear rejection. Each failure point maps directly to a measurement step in the framework, from answered calls through response time to signed jobs.
The bottleneck audit: the step contractors must complete before measuring anything
The first action is a 30-minute bottleneck audit, before tool selection. Start by asking how many inbound calls went unanswered in the last quarter. Then count how many quotes were sent without follow-up, how many invoices remained unpaid past their due window, and how many completed jobs received no review request. Use the existing records to attach numbers to those questions.
The invoice and review questions extend beyond the signed-job handoff. They show gaps in the work that can affect collections and future business, even when lead conversion looks good. Within the lead pipeline, record the available response-time data as well as unanswered calls and untouched quotes. Those figures establish where the handoffs stall.
Process gaps can make a tool look ineffective. If the underlying work is inconsistent or unmeasured, automation does not resolve the uncertainty about what failed. Buying first and investigating later leaves the contractor unable to separate a software problem from a workflow problem. The audit output should therefore be a ranked list of revenue gaps with existing baselines attached.
The case study framework: a repeatable before-and-after structure for each pipeline stage
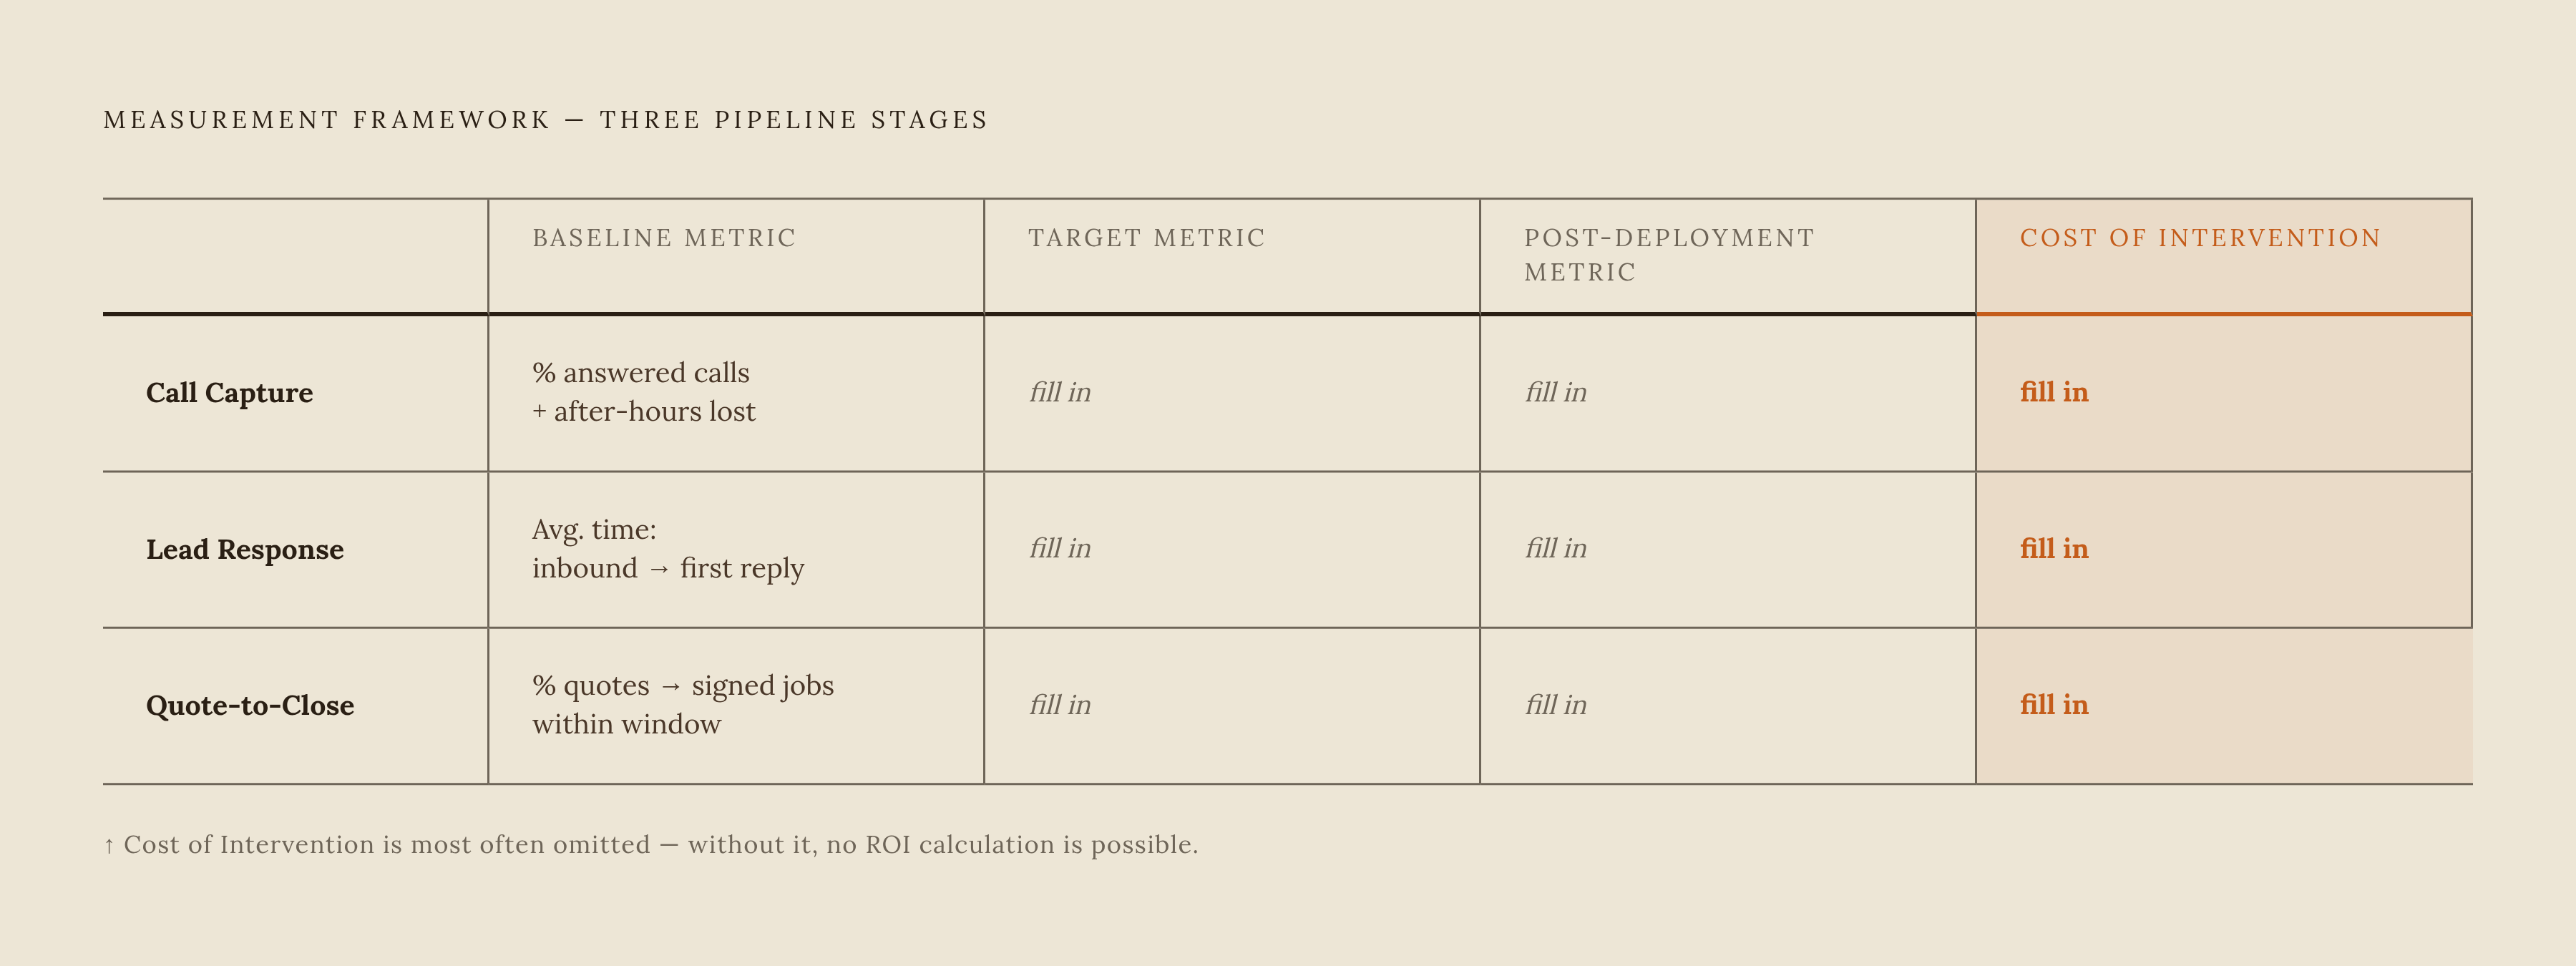
A rigorous case study records four fields for each stage, which are the baseline metric, target metric, post-deployment metric, and cost of intervention. The baseline is the number before deployment. The target states the expected improvement before results arrive, while the post-deployment field records the same metric at regular intervals over the first several months. The cost field includes the monthly subscription and any setup or implementation fee expressed as a per-month figure over the measurement window.
For call capture, the baseline includes the percentage of inbound calls answered and the number of after-hours calls lost per month. Near-complete capture within the first month is the proposed target. For lead response, record the average time from an inbound call or form fill to the first human or AI response. The target should be the response threshold tied to the highest appointment conversion rate, since there is no basis for assuming that faster is always enough.
Quote-to-close measurement needs a set conversion window. Its baseline is the share of sent quotes that become signed jobs within that window, and its target is a meaningful lift through automated follow-up. Monthly booked jobs then show how changes at each stage affect revenue. Record the pre-deployment average and average job value, with the target expressed as additional jobs attributable to recovered leads.
Hold marketing spend constant during the measurement window, because a simultaneous advertising increase prevents clean attribution to AI. Record intervention costs beside the revenue outcome. This structure can produce evidence of a return or an honest finding that the investment did not deliver, and both are useful decisions.
What the numbers look like when the framework is applied: documented cases by trade
The case of Maple Street HVAC in Columbus, Ohio, shows how call capture changed. The 14-year-old, three-van operation deployed a full AI automation stack in early 2025. Its missed-call baseline was 28 percent, and the reported result was a negligible missed-call rate, response time well under two minutes, and quote-to-close above half of quoted jobs. However, the supplied case details do not include its pre-deployment target or intervention cost, so they do not complete an ROI calculation.
A 15-truck Nashville HVAC company illustrates the booked-job outcome. Monthly booked jobs grew substantially without additional trucks or technicians, and annual revenue grew by more than a third. That connects automation to business growth more directly than a task count does, but the supplied details do not give exact monthly booking baselines or costs. A Dallas-Fort Worth HVAC business measured how an AI lead system performed over a 90-day window. The window is specified, but its numerical results are not.
The Southeast roofing company offers a clearer stage-level comparison. Its estimated-to-booked rate improved from 38 percent to 54 percent. Capital City Roofing applied workflow automation across lead intake, estimating, dispatching, insurance claims, and analytics, but the supplied details do not quantify its before-and-after results. The two examples therefore establish different things, one a conversion change and the other the scope of deployment.
Mid-State Plumbing in Columbus, Ohio, deployed an AI response system in March 2026. Each month, it turned enough previously lost leads into paying jobs to make a difference, with a healthy average job value. Exact counts and costs are not supplied. Across these trades, what gets measured stays the same, while call volume, job value, and how well the business did at baseline change.
Two failure modes that produce misleading ROI numbers
The first diagnostic check is whether automation accelerated an undiagnosed process gap. Leads logged differently by different staff, inconsistent qualification criteria, and callback scripts that depend on who answers all create variation before AI enters the picture. Faster execution does not make that workflow consistent. The framework’s check is to write the workflow as a plain-language sentence before deploying an agent. If the sentence cannot be written cleanly, the process is not ready.
McKinsey’s March 2025 State of AI report found that workflow redesign had the biggest effect on whether organizations saw EBIT impact from generative AI. The report also found that only 21% of respondents reporting generative AI use said their organizations had fundamentally redesigned at least some workflows. That finding supports auditing both the process and the tool. A disappointing result needs to be assessed against the workflow the AI was asked to run.
The second check is how well the tool category fits the work. All-in-one marketing platforms can emphasize feature breadth rather than deep integration with job data, which is the structural weakness identified in the notes. Before deployment, confirm that the tool connects directly to service area, pricing, and open calendar slots. A before-and-after comparison without that check may record underperformance without identifying its cause.
How integration depth affects what the ROI measurement captures
Five disconnected AI tools create an attribution problem across the pipeline. Data handoffs between platforms leave gaps, making it difficult to connect an answered call with a quote and a booked job. A unified platform gives the framework a single source of truth. In this measurement approach, integration is not merely a convenience, because the revenue claim depends on following the lead across stages.
Integration also affects the conversion being measured. A disconnected bot that does not know the contractor’s service area, pricing, or open calendar slots cannot book a job accurately. The framework may record that as a failed conversion, but the failure reflects the tool’s missing job data.
Platform fit changes the measurement window as well. The notes say that companies that choose home-services platforms get started faster and use them more than those that try to make a generic sales CRM work for field service. For contractors evaluating that fit, the relevant requirements are unified tracking of calls, quotes, booked jobs, and reviews, with agents handling marketing, response, quoting, and operations in one stack. Those capabilities make stage-level performance measurable without manually assembling multiple exports.
What a completed contractor case study looks like: a template with real benchmarks
The completed case study is a one-page record that a vendor, partner, or investor can audit. The following fillable paragraphs provide its structure. Blank fields stay blank until business records back up what goes in them. Benchmarks give context, but they do not replace the contractor’s own baseline or prove a financial return.
Business profile. The type of contracting work is [___], the market size is [___], the crew count is [___], and the annual revenue before deployment was [___]. The bottleneck identified in the audit is [___]. State that problem in one plain-language sentence and identify the single pipeline stage targeted. The expected improvement, recorded before deployment, is [___].
Intervention and measurement window. The tool or stack deployed is [___], with deployment date [___], monthly cost [___], and implementation cost [___]. The baseline measurement window is [___], and the post-deployment measurement dates are [___]. Record concurrent changes in marketing spend, staff headcount, or service area here [___]. These changes may affect attribution even when the reported revenue is accurate.
Baseline and post-deployment metrics. Before deployment, the call answer rate was [___], average lead response time was [___], and quote-to-close rate was [___] within a conversion window of [___]. The average number of monthly booked jobs was [___], and the average job value was [___]. Enter the same five metrics each time they are recorded [___]. Relevant comparison points include Maple Street’s negligible missed-call rate and response time well under two minutes, and the Southeast roofer’s estimated-to-booked improvement from 38 percent to 54 percent.
Revenue and cost calculation. Incremental revenue is (new booked jobs per month − baseline booked jobs per month) × average job value × months measured. Total intervention cost is monthly tool cost × months + implementation cost. Net ROI is (incremental revenue − total cost) ÷ total cost, expressed as a percentage. Record incremental revenue [___], total cost [___], and net ROI [___], with any limits on attribution stated beside them.
Decision and review record. At 30 days, the decision is to expand deployment to a second stage or discontinue the tool [___], supported by these measured results [___]. Repeat the measurement at regular intervals through the first year to capture effects such as review volume and recurring contract attach rate that may not appear in the first month. Any vendor claiming ROI can be asked to supply this same record. The completed document provides evidence to retain a good investment and the discipline to cut a bad one before it costs more than it recovers.