Cost per Booked Job Calculation for Contractor Marketing Channels
Close rate, not lead price, determines what you actually pay for each booked job.
Most contractors rank their marketing channels by cost per lead, and that ranking is wrong. Cost per lead ignores the one variable that actually makes a channel profitable: how often a lead turns into a signed job. A channel with a cheap lead price and a weak close rate can cost more per booked job than a channel with an expensive lead price and a strong one. Lead price is only half the equation, and treating it as the whole equation sends budget to the wrong places.
The remodeling benchmark data states it directly: "The best remodeling lead channels in 2026 are the ones with the lowest cost per booked job, not the lowest cost per lead. Those are two different numbers." HVAC channel data makes the same argument from a different trade: "Cost per lead alone misleads. The number that decides profitability is what a booked job costs after book rates enter the math." Two channels with different CPLs can land on the same cost per booked job. Two channels with identical CPLs can produce wildly different outcomes once close rate enters the picture. The instinct to chase the cheapest lead feels responsible, but it routinely gets the allocation backwards: a contractor cuts the channel that looks expensive on paper and pours more money into the one that looks cheap, when the opposite move would have been correct.
The formula: CPL divided by close rate equals cost per booked job
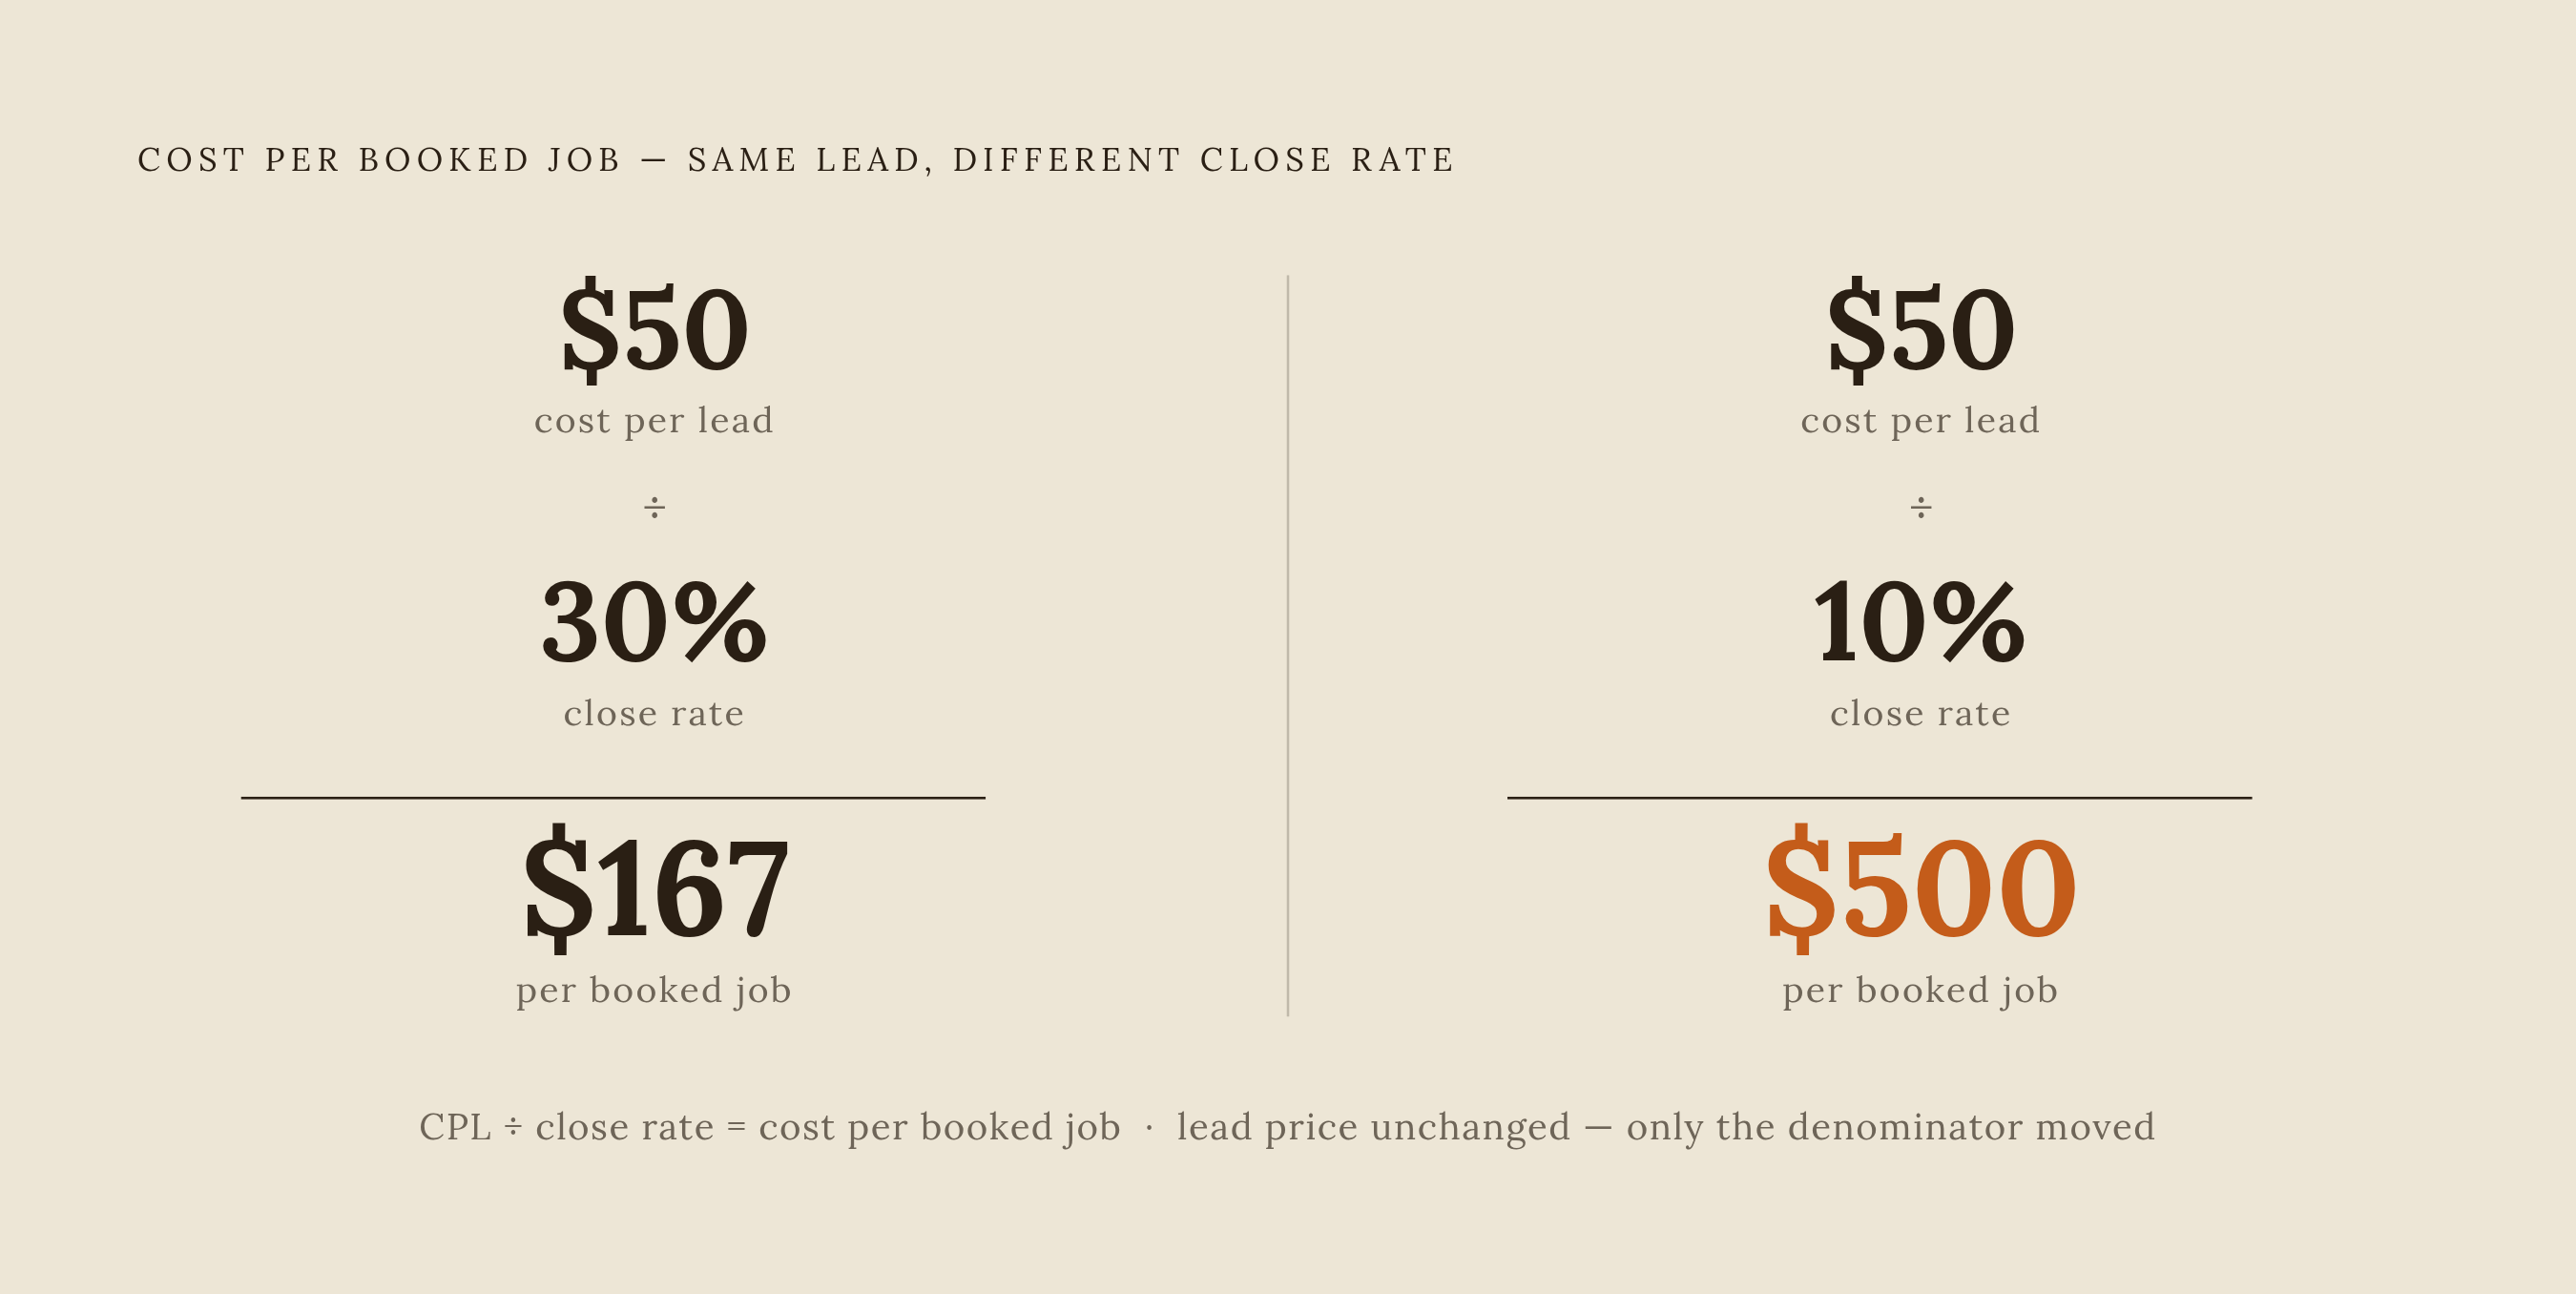
The fix is a single calculation. Take cost per lead and divide it by the lead-to-job close rate, expressed as a decimal. Cost per booked job is what a contractor actually pays, on average, for each piece of signed work that channel produces.
Run two versions of the same lead price to see what the formula does. A lead that costs a given amount and closes at a high rate produces a low cost per booked job. The exact same lead, at the exact same price, closing at a low rate instead, can produce a cost per booked job two to five times higher. The lead price never moved. The only thing that changed was how often it turned into a job, and that single shift was enough to make the channel look entirely different on the bottom line. The remodeling channel guide works through this with real worked examples, and the arithmetic holds up the same way every time: close rate, not lead price, is doing most of the work.
The part of this formula that matters most for a contractor's decision-making is the denominator. Lead price is largely set by the channel, the market, and competition. Close rate is not. Response speed, follow-up persistence, and quote quality all move it, and all three sit inside a contractor's own operation. That means a contractor has real influence over cost per booked job, even on channels they do not control the pricing of.
Running this calculation requires only two numbers per channel: what was paid for the leads, and how many of those leads became jobs. Most contractors already have both figures sitting in invoices and a CRM. The gap is a habit that has not been built yet.
What the formula produces across real channel benchmarks
When cost per booked job is calculated across the major paid channels, the ranking that results almost always looks different from the ranking cost per lead alone would suggest. The channel that looked most expensive per lead often turns out to produce the cheapest booked job, and the channel that looked cheapest often turns out to be the most expensive once close rate is factored in.
Google Local Services Ads against non-branded search is a clear example. HVAC benchmark data shows LSAs producing a meaningfully lower cost per booked job than non-branded search, even though non-branded search CPL is the number most often treated as the standard paid benchmark. Plumbing benchmark data tells the same story from a different trade: LSAs average a lower cost per lead and book at a higher rate than non-branded search, which compresses cost per booked job from both directions at once. At a mid-range close rate, the gap between Meta and non-branded search in cost per booked job is substantial, even in cases where the two channels looked nearly identical by cost per lead alone.
Shared-lead aggregators make the sharpest case for why this formula matters. Electrical contractor data shows shared marketplace leads producing the highest cost per booked job of any channel measured, and the cause is structural: those leads get distributed to multiple contractors at the same moment, which drags close rate down into a 5 to 15 percent range. No amount of follow-up speed fixes a lead that three other contractors received at the exact same time. That is a limitation built into the channel itself, not something an operator can out-hustle.
Branded search deserves its own mention as a special case. HVAC data puts Local Services Ads at the lowest cost per booked job across the entire paid mix, with branded search coming in lowest within Google Ads campaign types specifically. That makes sense once the audience is considered: those are past customers searching the company's own name, already intending to hire again, and they convert at the highest rate of any segment measured. Roofing's cost per lead runs high relative to other trades, and that figure is worth keeping in view, but the aggregator example teaches the lesson more sharply for most remodeling and hardscape contractors: the ranking reshuffles once the full formula runs, and the channel that looked cheap on the surface is sometimes the one doing the most damage to the budget.
Close rate's effect on cost per booked job
Lead price sets a floor. Close rate decides what actually gets paid above that floor, and it swings the final number more than the price of the lead does. For any given lead price, a contractor who books a higher share of leads pays less per booked job than a contractor on the exact same channel booking fewer of them. That gap in close rate between a fast responder and a slow one is large enough to flip the ranking between two channels.
Speed to lead drives most of that gap. Plumbing marketing benchmarks cite a Harvard Business Review response audit finding that contractors who respond within the first hour are nearly seven times more likely to qualify a lead than those who wait longer. That single factor, response time, can outweigh almost everything else in the formula. A contractor who responds slowly to Local Services Ads leads may end up paying more per booked job from LSAs than a competitor who responds fast pays from non-branded search, a channel that looks more expensive by cost per lead alone. Worked well, a pricier channel beats a cheaper one worked poorly.
Close rate is partly set by the channel and partly set by the operator. Aggregators structurally depress it through simultaneous distribution, and no amount of hustle changes that math. Everything else in close rate, on every other channel, responds to how fast and how consistently a contractor follows up. That distinction matters for decision-making: before cutting a channel because its cost per booked job looks high, a contractor should check whether that number reflects a ceiling the channel imposes or a ceiling the contractor's own follow-up has imposed on itself.
AI-driven follow-up and close rate
Close rate is a lever a contractor can pull, and the most reliable way to pull it across every channel at once is to close the gap between when a lead arrives and when someone responds to it. AI-driven response handles that gap without adding a single person to payroll.
Speed to response is the clearest version of this lever. Responding within a narrow window after first contact is the threshold where booking conversion hits its highest published rate, and the industry average response time runs far longer than that window, leaving a wide gap in conversion between fast responders and slow ones. Closing that gap raises the denominator in the cost-per-booked-job formula on every channel a contractor runs at the same time. The leads do not get cheaper. They convert more often, and the cost per booked job drops as a direct result.
The effect does not stop at first contact. Automated, multi-touch follow-up sequences sent after a quote goes out lift quote-to-close rates in a meaningful way, because they maintain a cadence of persistence that a human office rarely sustains across a full pipeline of leads, week after week. Jobber's home service trends data finds that businesses reporting high confidence in their operations use AI at a far higher rate than low-confidence peers, and that adoption gap functions as a real competitive advantage for the businesses moving first. The same data shows that among businesses already using AI, quoting, invoicing, and business writing are the leading use cases today. Response automation, the highest-return starting point of the group, is still underused by many of them.
The practical effect on the formula is direct: a faster close rate on the same lead volume, at the same cost per lead, lowers cost per booked job, often by more than switching channels entirely would accomplish. Several platforms give contractors a path to build this. Housecall Pro offers an AI layer suited to HVAC, plumbing, electrical, and other home service operations across business sizes. Jobber pairs with Route Optimization for landscaping and maintenance crews. ServiceTitan Max serves residential in-home contractors, with a limited pilot extending to commercial and roofing firms. Service Fusion fits small to mid-size service contractors in HVAC, plumbing, electrical, and similar trades. Close rate, once treated as fixed, is now a variable a contractor can move with available tools.
Lifetime value and cost per booked job
Cost per booked job only means something next to the revenue it unlocks. A channel with a high cost per booked job can still be cheap relative to what a customer is worth over time, and a channel with a low cost per booked job can still lose money if it only ever brings in one-time, low-value work.
Lifetime value differs sharply by trade. HVAC generates high lifetime value largely through maintenance plan attachment, where one job turns into years of recurring service. Roofing generates high value concentrated in a single large project. General contractors and remodelers generate the highest per-customer lifetime value of any trade in the comparison. The ceiling on what they can afford to pay per booked job sits well above what a one-off repair trade can justify. Hardscape contractors see the same split inside their own customer base: the retired homeowner improving quality of life and the new-homeowner building an outdoor entertaining space both carry meaningfully higher lifetime value than a one-time repair customer, and that difference should shape how much a hardscape contractor is willing to spend to land each type.
The practical rule follows directly from that: a contractor should set a maximum acceptable cost per booked job by working backward from lifetime value and target margin, not by matching whatever competitors appear to be paying. Published benchmarks are a sanity check against that number, not a target to hit.
Private equity-backed consolidators already run this math at scale. Data on private equity in home services shows consolidators spending a substantially higher share of revenue on marketing than independent shops, and recovering that spend through lifetime value over a longer customer relationship. They are playing a different version of the same formula, backed by a clearer view of what each customer is worth. An independent contractor who knows their own lifetime value number can run that identical calculation and compete on budget wherever the math supports it, instead of defaulting to whatever lead happens to be cheapest that month.
Running the calculation across your own channels and deciding what to do with the result
Running this calculation across a contractor's own active channels almost always produces a ranking that differs from what the cost-per-lead dashboard suggests, and that difference is the decision that needs to get made.
Start by pulling real numbers rather than assumed ones: cost per lead by channel from invoices or platform reporting, and close rate by channel from CRM or job records. Close rate needs to be tracked per channel rather than applied as one blended average across all of them, because close rate varies by channel, and that variation is why this math matters. Calculate cost per booked job for each channel and rank them from lowest to highest. For any channel landing high on that list, check whether the channel itself charges too much or whether response speed or follow-up consistency is dragging the close rate down, since the fix for one has nothing to do with the fix for the other. Set a maximum acceptable cost per booked job for each project tier based on lifetime value and target margin, then cut or shrink the channels landing above that line and push more budget toward the ones landing below it.
Contractors running only one or two channels with small lead counts can still use published benchmarks as a starting assumption for close rate, refining the number as their own data builds up. The benchmark math is a starting point for a contractor without much data yet, not a permanent substitute for measuring the real thing. A platform that tracks a lead from its source all the way through to a booked job turns this calculation into something automatic rather than a manual spreadsheet exercise redone from scratch each time. Most contractors who run this calculation once end up running it monthly after that, because channel performance shifts as markets move and budgets change, and the ranking rarely stays still for long.